
You think you know how common travel chains look like? You’d be surprised if you could see them in reality! With Process Mining you can visualize and improve them on a large scale.
“Data is the new oil” – but data only creates value if you know how to make use of it. Process Mining taps into this potential by combining Data Mining with Process Management techniques. It is a rather new discipline, which allows to understand and improve processes using their digital footprint. Common applications are processes in administration, e-commerce, logistics or production. But Process Mining techniques can also be applied to mobility if each segment of a travel chain – so each switch of a transport mode – is considered a separate process step and tracked in a data point. We’ll have a look how this works and how travelers, transport authorities and municipalities could benefit from it.

What is Process Mining?
Process Mining is a set of process management and data mining techniques that support the analysis of business processes based on so called event logs. In event logs each process step is captured with a
- Case id – representing a unique identifier for a process instance or journey/travel chain in mobility terms
- Activity Name – specifying what happens in the respective process step or segment of a travel chain
- Date/Time stamp – capturing when it happens in order to be able to sort the activities and analyse it for time-dependent metrics
- Attributes – giving context to each activity. For travel chains this could be e.g. the mode of transport, its costs or CO2 emissions
Process Mining aims to improve the understanding of processes, process efficiency, and conformity with desired standard processes. Watch this short introduction video.
Application of Process Mining in New Mobility
If millions of travelers use different modes of transport every day, it is hard to keep an overview and draw conclusions about how to best support them. Process Mining can help transport authorities and traffic planners e.g. to:
- Define an optimal modal split
- Identify ideal spots for Park & Ride or mobility hubs
- Simulate changes in travel patterns
- Optimize bus routes
- Minimize the need to change vehicles or transport modes
Transportation companies could identify patterns and root causes for:
- Empty rides
- Idle times
- Delays
Individual travelers could also track their own journeys and benefit e.g. from:
- Carpooling suggestions if data indicates that other travelers could give you a lift
- Occupancy alerts to avoid congestion or overcrowed public transport vehicles during the COVID-19 pandemic
- Routing suggestions dependent on multiple criteria, such as speed, safety, convenience, climate impact, … and compare real travel chains with optimal travel chains using conformance checks
- Intermodal routing suggestions considering availability of transport modes based on data of previous rides like in this example: Google Maps seem to have recognized that I took a bike on my way to the destination for the last mile. So it correctly suggests to start with a bike on the way back.

Key for any Process Mining project is a clear definition of its scope and purpose. Otherwise users might get lost.

Mobility Data Gathering and Extraction
Digital processes in eCommerce, online banking, or automated logistics, etc. usually produce well-defined data, which can easily be used for Process Mining. This is different in mobility. Travelers usually don’t leave clear digital footprints, which a process miner could follow easily. But enhancing the raw data would allow to “mine” these travel chains and improve them.
The cleanest data can be obtained using journey tracking apps, which automatically detect the mode of transport and get their data validated by the user. These apps use data from different phone sensors and interfaces, such as GPS data, WLAN connections, Bluetooth beacons at train stations, bus stops or in vehicles, acceleration and vibration, magnetic field data and so on in order to identify the mode of transport. This requires active engagement of travelers and so limits the data source but provides very accurate data.

Modified screenshot of a journey tracker from MotionTag
Automated Transport Mode Recognition
Another source of data could be the data each smart phone creates during regular operations. Most travelers leave digital traces by carrying a smart phone, which switches from cell to cell or connect to WLAN hotspots during a trip. Tracking data of these “handshakes” could be good enough data with a high coverage of travelers. Properly anonymized these data could be used compliant to data privacy laws. The challenge will be to translate these “big data” into event logs suitable for Process Mining. By combining mobile phone data with map information, data from public transport vehicles or other travelers, these data can often be interpreted and translated into single steps of a travel chain. Let’s have a look at an example of two travelers both heading from the same origin to the same destination:

Here’s another set of geo location data showing another journey with the same origin and destination. Spot the differences!


Without any information about the different segments and their modes of transport, we could only see that there where two trips from A to B. Not very insightful.
In order to better understand how the traveler’s journeys look like, we need to identify their different journey segments – or speaking in Process Mining terms: activities.
It would make sense to define each mode of transport as one segment or activity. Lets see how this could be derived from the data points above in combination with map data and other contextual information, e.g. such as knowing that buses likely stop at bus stops and both buses and cars may need to stop at crossings.
The data points of the journey above could come from a cell phone – either from cell connection handshakes or from an app tracking the location periodically. Small distances indicate a slow mode of transport, such as walking or congestion in front of a red traffic light at crossings. Combined with map data the geo location data can give a good indication if higher speed transport is more likely via a car (following streets) or via trains (following railway tracks). In the example below we apply this approach on the geo location data from the first example.
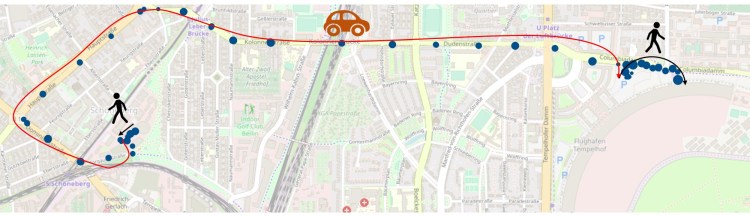
Given some context and combining the geo location data with map information, the above mentioned data points can be automatically translated into different segments of a travel chain with the respective modes of transport:
- The trip starts with a walk to the car park at the origin.
- Indicated by speed and following the street, the next segment is likely taken by a car stopping at two crossings and ending at a car park near the destination.
- The thirds segment is again a short walk from the second car park to the final destination.
Any idea what segments and modes of transport the second journey could consist of?

- It starts with low speed from the origin to the nearest commuter train station.
- The next segment shows just a few data points, so with rather high speed and ends at the next train station. Likely the traveler took a commuter train.
- This is followed by a short walk. Knowing that the walk ends at a bus station gives a hint on the mode of transport for the next segment.
- The next segment shows more dense data points than the car trip of the previous example, indicating a somewhat lower speed. The speed is roughly the same as with a bike but shows two stops at other bus stations and and also ends at another bus station. So it was likely taken by a bus. This assumption can be validated if we could compare it with the data points generated by the bus or other passengers on the bus. If they all show the same pattern, they likely shared a ride on the same vehicle.
- The last segment is again a slow walk from a bus station to the final destination.
Now we can differentiate between the two journeys – or cases or “process instances” in Process Mining terms.


Widening the Data Pool
We will rarely have many travelers with exactly the same origin and destination. So the data pool will be limited – unless we also make use of other traveler’s journeys containing this route within their overall journey: They might come from different origins and go to different destinations but they share the same fraction of a journey. This could be from entering the city at a certain crossing to reaching a point at the central business district (CBD). By only looking at this fraction of the journey, we can compare and analyse the different journeys and make use of a much bigger data pool.
Adding Context
Additional contextual information can enrich the data and help to draw sound conclusion and indicate a need for specific modes of transport, e.g.
- Considering appointments in the user’s calendar (e.g. picking up kids from school)
- Connected travel chain segments (e.g. need to catch a flight)
- Number of joint travelers (e.g. single traveler vs. entire family)
- Traffic information (congestion or occupancy of public transport)
- Weather conditions
- Limited mobility
- Luggage
- Costs
- …
Detecting specific travel patterns based on context and automatically drawing conclusions from it is uncharted territory and likely to become a play ground for Machine Learning applications. Exciting times ahead!
Further Information
- Excellent online course on Process Mining from the godfather or Process Mining: Prof. Wil van der Aalst
- Scientific paper on “Process discovery on geolocation data” from Joel Ribeiro, Tânia Fontes, Carlos Soares and José Luís Borges
- A deeper look into “A Query Language for Mobility Data Mining” from Roberto Trasarti, Fosca Giannotti, Mirco Nanni, Dino Pedreschi and Chiara Renso
- The scientists already researched on the carpooling use case mentioned above in “Mining mobility user profiles for car pooling” from Roberto Trasarti, Fabio Pinelli, Mirco Nanni and Fosca Giannotti
Process Mining Tools
Here’s a short and incomplete list of common Process Mining tools. Most tools allow to detect and analyze the process, some also allow for simulations, derive decision rules or identify root causes for bottle necks and further Six Sigma analyses:
- Apromore – also offers an OpenSource version with some functionality.
- Celonis Snap – is the cloud-based, follow-the-free version of Celonis for an easy entry. Most screenshots of this post were taken from Snap.
- Disco – one of the first commercial process mining tools with simulation capabilities.
- Lana Labs – has a focus on process improvement via Machine Learning.
- ProM – Open Source and one of the first tools from academia. ProM requires understanding of the theory and takes getting used to it.
- Signavio – has a tight process modeling and rules engine integration.
What are your ideas on applying Process Mining to the mobility sector? I am looking to hearing from you in the comments.
[* Shield plugin marked this comment as “Trash”. Reason: Failed Bot Test (checkbox) *]
Hi, I would add on the list also myInvenio (www.my-invenio.com). It offers a complete suite from Process Discovery, Task Mining, Business Rules Mining to unique simulation capability.
Pingback:Process Mining for Mobility - Apolix
Pingback:Process Mining for Mobility? This is what you need to know - Apolix